 ExplainThisDoc
Understand blood test results: read your lab report in plain words
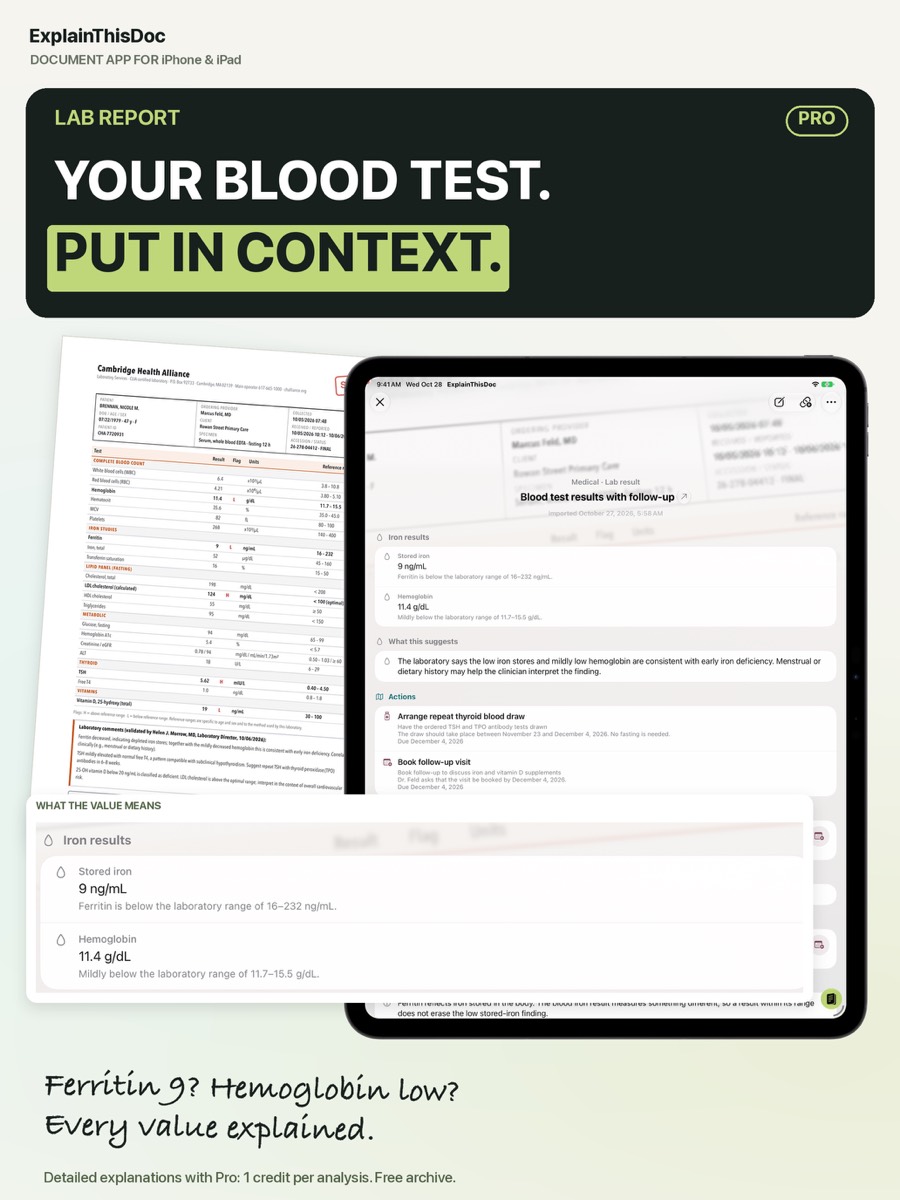
“Ferritin 9? Hemoglobin low?” A lab report is a table full of abbreviations, and some values are flagged. Before you worry or start searching online: with three columns in view, you already understand much more. This how-to explains them and shows how ExplainThisDoc puts every value in context.
Value, unit, reference range
A lab report lists each result with its unit and the lab’s reference range. Ranges differ between labs, methods, age and sex, so always compare a value with the range on the same report.
What abbreviations like MCV, ALT or eGFR stand for is listed in Blood test abbreviations.
Put flagged values in context
An arrow, “H” or “L” means a value is above or below the reference range. That is a signal, not a diagnosis: healthy people sometimes have single values outside the range. What matters is the context with other values, symptoms and earlier results.
Example: what ExplainThisDoc shows
The explanation goes value by value: what does stored iron or hemoglobin measure, and how does the result compare with the range? In the example, it shows that stored iron of 9 ng/mL is below the lab’s range. See how different AI models explain the same report in our blood test comparison.
Trends and questions for your visit
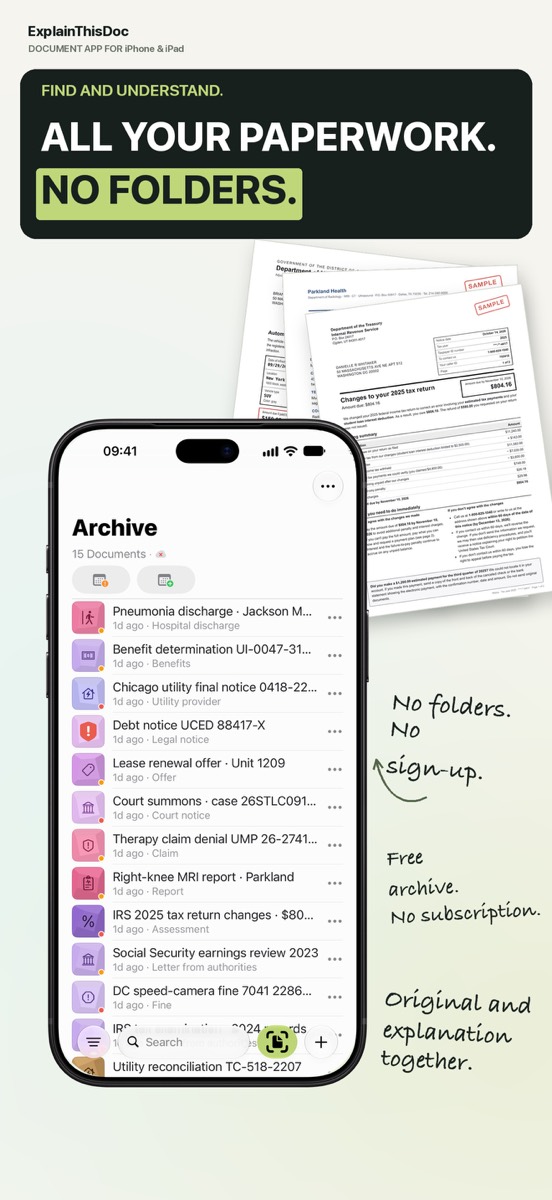
A single value says less than its trend. Search “lab” in your archive to have earlier reports side by side, and write your questions right next to the report.
Important: the explanation helps you understand, but it is not a diagnosis and does not replace your doctor.
Get your lab report explained
Snap or import
Scan a document or bring in a photo or PDF. No sign-up, no folders.
Understand it in plain words
Light analysis, free on your device¹. In depth with Pro: 1 credit per analysis.
Find it when you need it
The original, the explanation and your notes stay together in your archive.
- No sign-up
- No subscription
- Start right away

 Scan with your iPhone camera
¹ With Apple Intelligence enabled on a supported device and in a supported language.