
Guides / Blood report comparison
One blood report.
Four explanations.
The same English laboratory report, explained in ExplainThisDoc with Qwen, Mistral, OpenAI and Apple Intelligence. The recording shows how differently they organise values, context and terminology.
Qwen walks through the lipid values. Mistral combines a short interpretation with report details and a glossary. OpenAI puts cholesterol and follow-up questions first. Apple Intelligence presents a short summary and expandable facts.
The starting point
A blood count and a lipid panel
The visible results describe a blood count within the report's reference ranges and highlight total cholesterol and LDL. These are statements made by the recorded analyses, not a new medical assessment by this article.
We compare what appears on screen: the order of the information, the explanations attached to values, the suggested discussion points and the amount of specialist language left unexplained.
The same values
- Total cholesterol
- 218 mg/dL
- LDL cholesterol
- 137 mg/dL
- HDL cholesterol
- 61 mg/dL
- Triglycerides
- 109 mg/dL
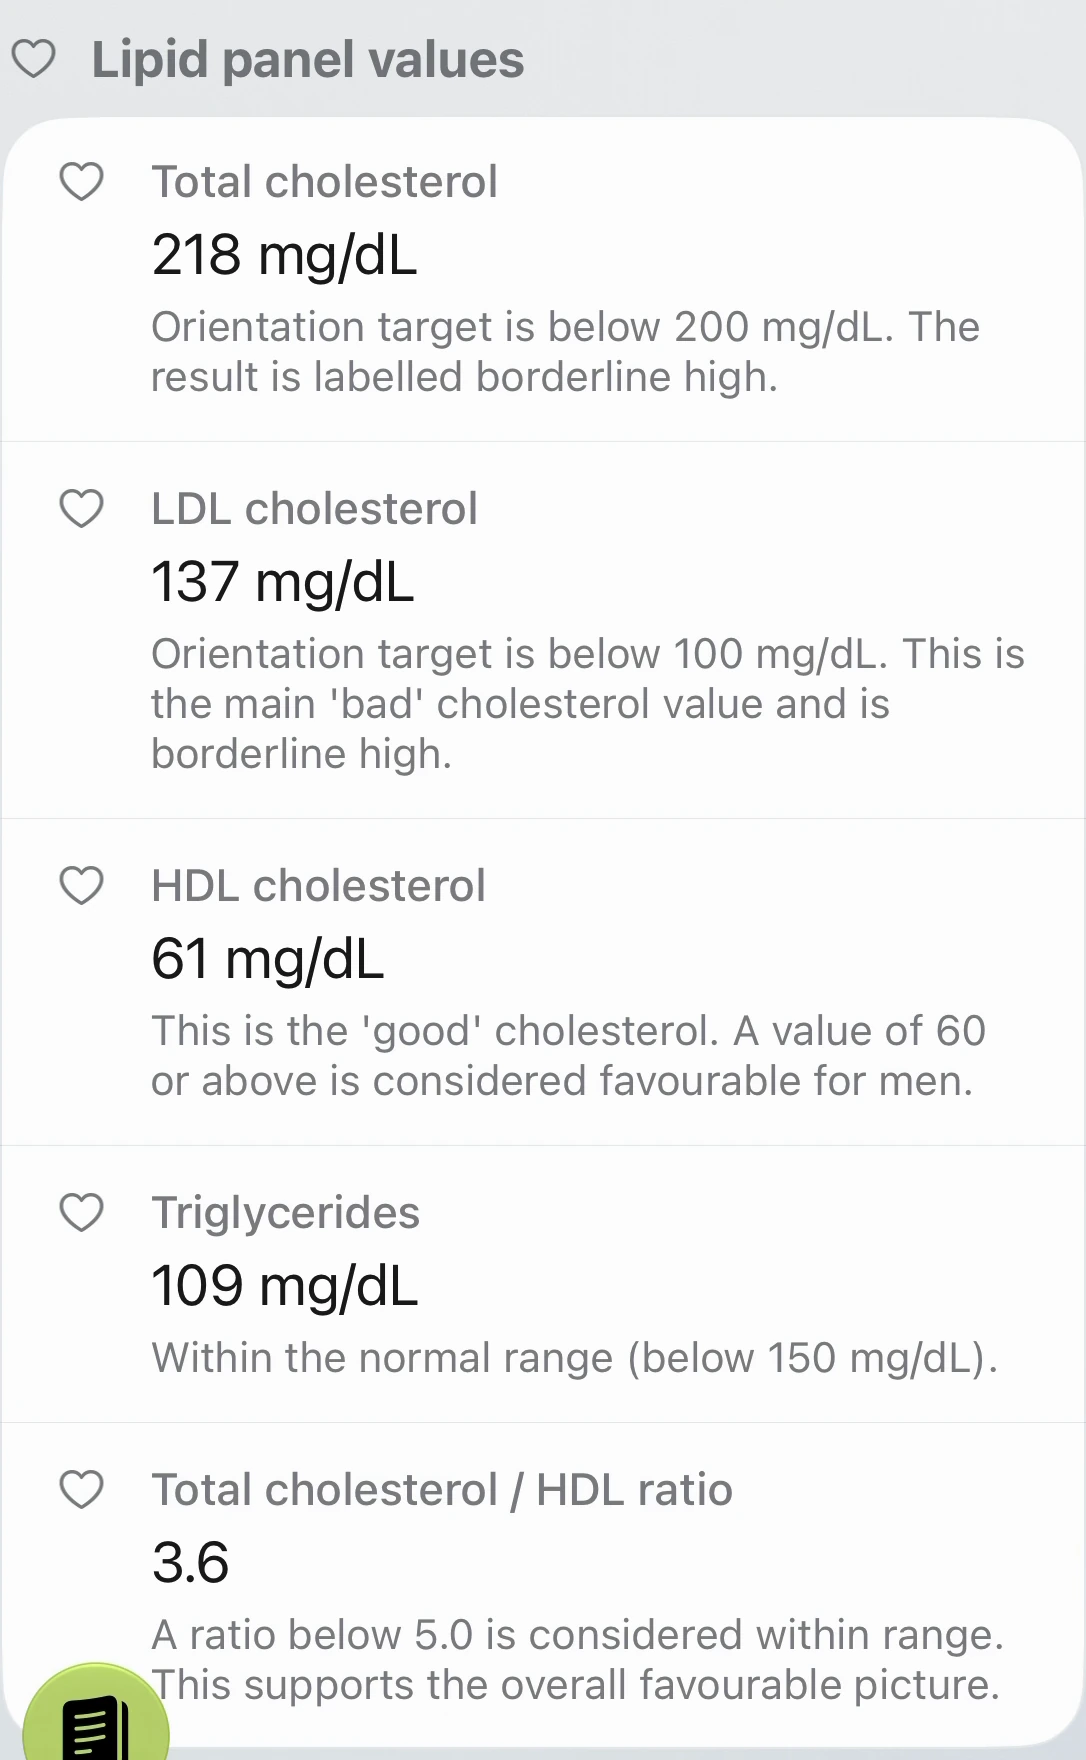
Qwen also displays the total cholesterol/HDL ratio: 3.6.
Four visible approaches
What each result brings forward
Qwen
Five lipid values, then the wider context.
Values and context02Mistral
A short interpretation, report details and five explained terms.
Report and glossary03OpenAI
Cholesterol first, followed by context and concrete questions.
Priorities and questions04Apple Intelligence
A short summary and facts that expand on demand.
Local quick analysisThese observations concern the results in this recording. They are not a general ranking of the providers.
01 / Qwen
Each lipid value gets its own explanation.
Qwen first summarises the blood count in prose. Its lipid panel then gives total cholesterol, LDL, HDL, triglycerides and the total/HDL ratio separate rows, each with a short explanation and a reference threshold.
A separate context section links the interpretation to blood pressure, smoking, diabetes, family history, weight, medicines and previous results. It distinguishes a general LDL orientation threshold from a target based on individual risk.
The result suggests discussing whether a repeat lipid test or a formal risk assessment would be useful. It also explains LDL, HDL and full blood count. The blood-count measurements themselves are not listed individually in the shown result.
The visible strength is the separation of individual values, context and next discussion points.
Waiting time reported by the recorder: 4:43. How the time was measured
02 / Mistral
A concise explanation surrounded by report details.
Mistral's title already summarises its interpretation: normal blood count, mildly elevated cholesterol. The opening text names total cholesterol at 218 mg/dL and LDL at 137 mg/dL; HDL and triglycerides are described without separate numeric rows in the shown result.
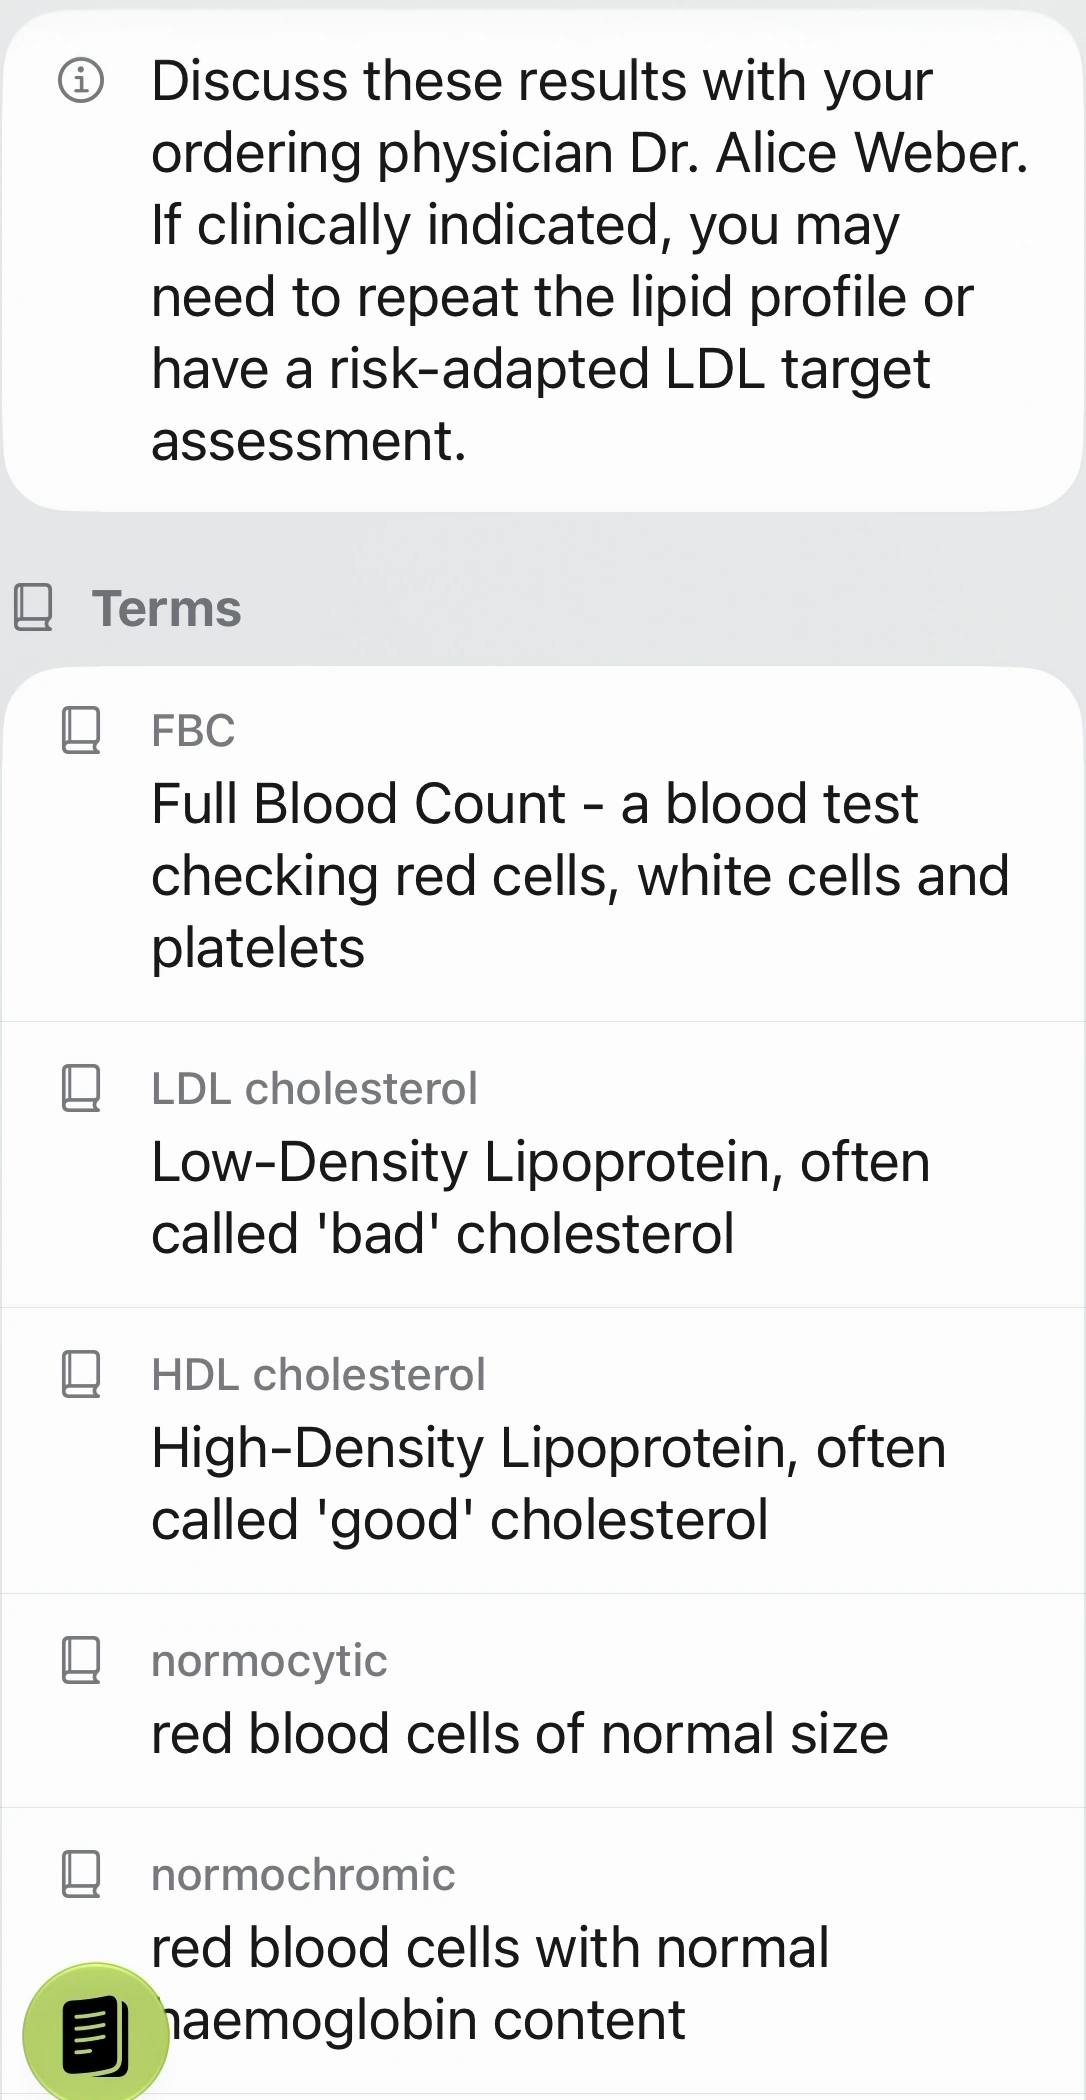
Much of the result organises patient, laboratory and specimen details into fields, many with copy controls. One label remains in German: “Adresse”. The medical interpretation is short and notes that LDL targets depend on the person's risk profile.
A doctor-discussion section is followed by five glossary entries: full blood count, LDL, HDL, normocytic and normochromic. The last two explain normal red-cell size and haemoglobin content.
The distinctive emphasis is on report details and a glossary, with a relatively brief interpretation.
Observed waiting time: approximately 2:12. How the time was measured
03 / OpenAI
The cholesterol values lead into a conversation.
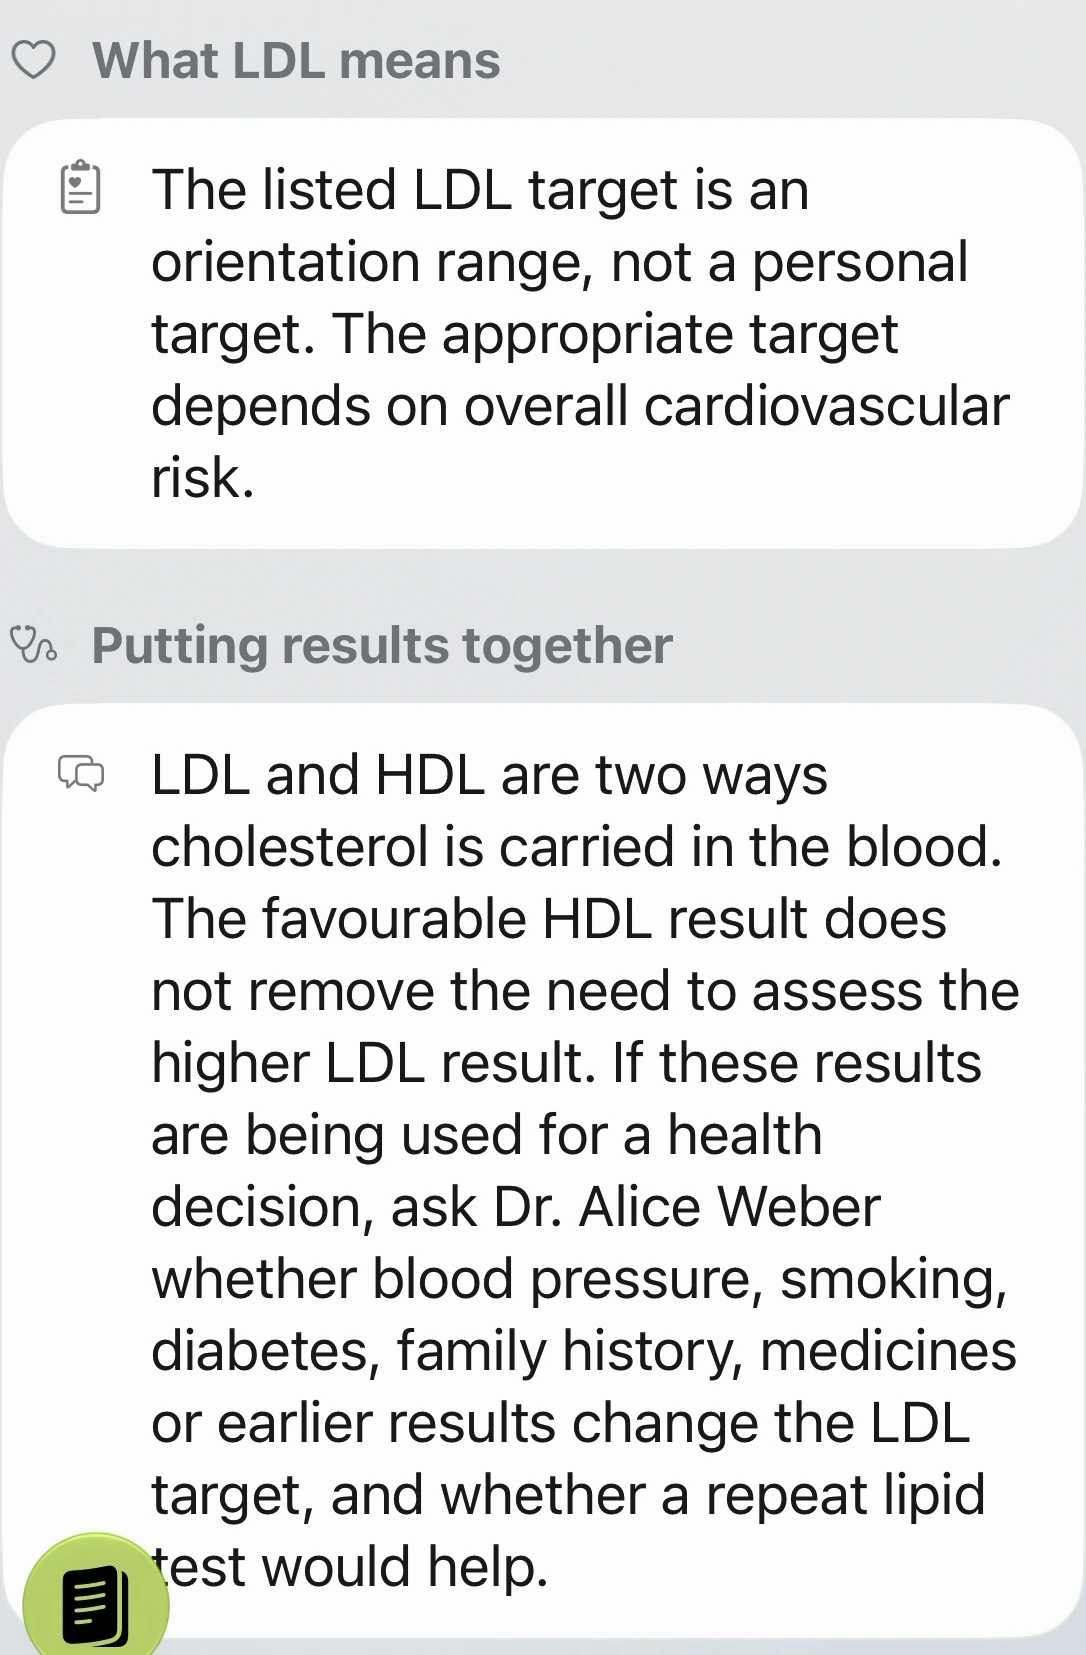
OpenAI begins with four cholesterol-result rows, putting LDL first. Separate sections then explain what the LDL target means and how the results fit together. The report reference and blood-count summary appear further down.
The explanation distinguishes an orientation range from a personal LDL target. It explicitly says that a favourable HDL result does not remove the need to assess the higher LDL result.
It turns the risk context into concrete questions for the ordering doctor: do blood pressure, smoking, diabetes, family history, medicines or earlier results change the LDL target, and would a repeat lipid test help?
The recorded result makes priorities and questions for a medical conversation particularly easy to find.
Observed waiting time: approximately 0:50. How the time was measured
04 / Apple Intelligence
A compact structure with more technical language.
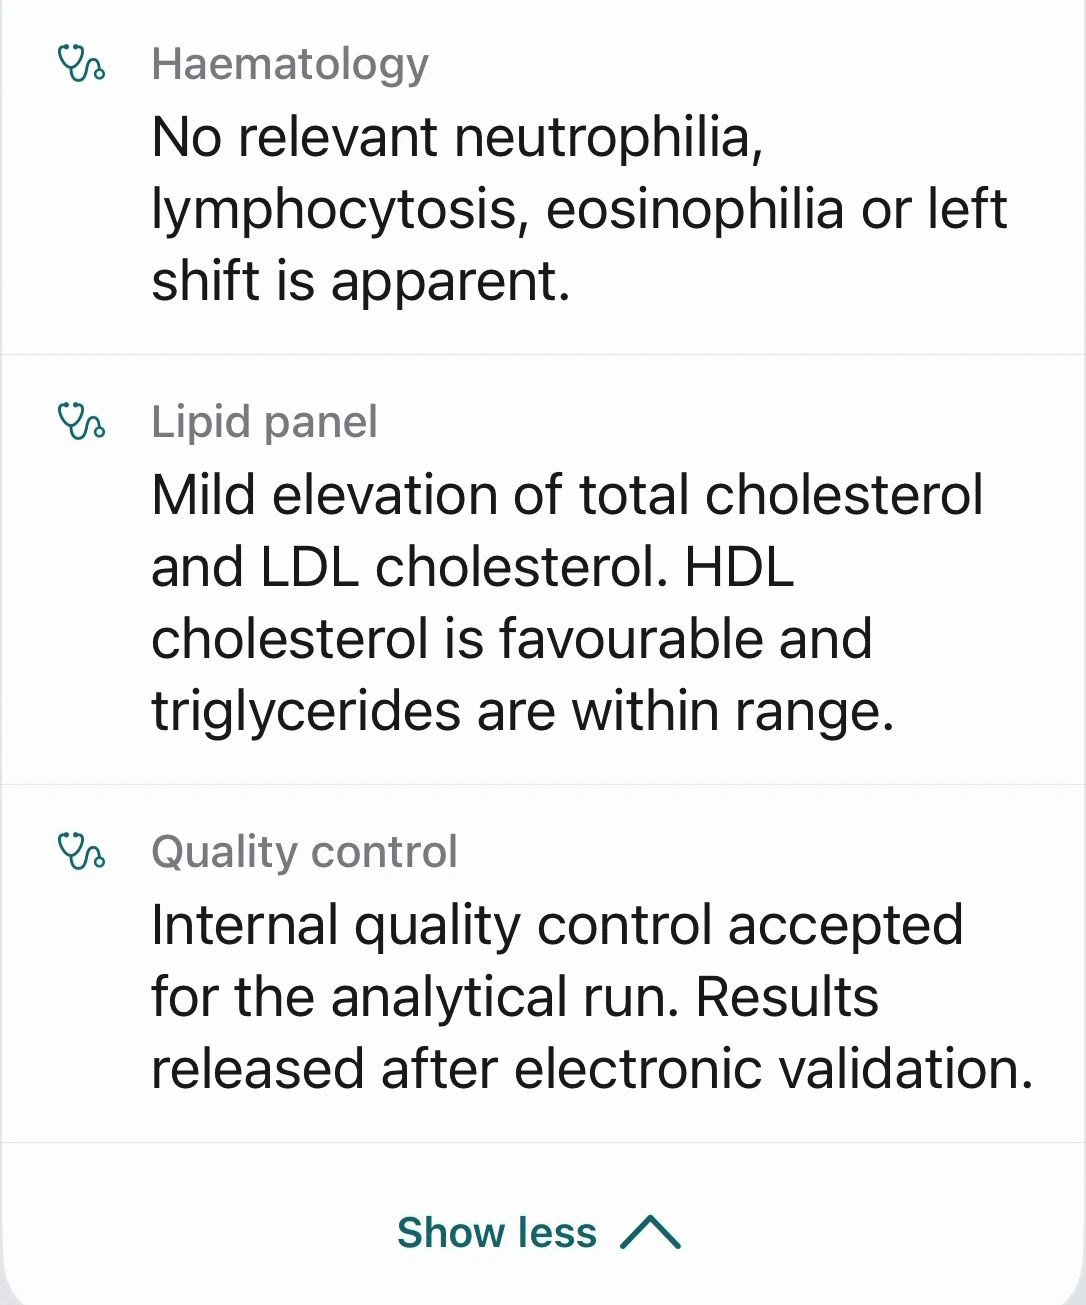
Apple Intelligence runs in the app's Quick analysis mode. The result has two sections: “Short summary” and “Core facts”. The summary includes the four lipid values and several blood-count findings in a dense paragraph.
The first four facts cover red blood cells, haemoglobin, total cholesterol and haematology. “Show more” adds lipid-panel and quality-control facts. Red blood cells are shown as 5.07 T/L and haemoglobin as 15.2 g/dL, both with reference ranges.
Terms such as leukocytosis, thrombocytopenia and left shift remain unexplained in the visible result. It does not show a separate glossary, LDL-target discussion or list of questions for a doctor.
The structure is short and expandable; understanding the summary still requires more familiarity with medical terms.
Observed waiting time: approximately 0:21. How the time was measured
Waiting time in this example
How long did the analyses take?
Times are shown in minutes:seconds. Qwen's 4:43 was supplied by the person who made the recording. The other three durations were measured in the video. Apple Intelligence uses Quick analysis; the cloud providers use Full analysis, so the modes have different scopes.
Qwen
4:43Reported by the recorder · Full analysisMistral
2:12Approx. · measured in video · Full analysisOpenAI
0:50Approx. · measured in video · Full analysisApple Intelligence
0:21Approx. · measured in video · Quick analysisTiming method and limits
For Mistral, OpenAI and Apple Intelligence, timing starts at the first visible “Analyzing” state and ends when the archive header no longer shows processing after saving. The table gives positions in the original recording, not the edited video above.
| Provider | Start | Saved | Duration | Evidence |
|---|---|---|---|---|
| Qwen | — | — | 283 s | Reported by the recorder |
| Mistral | 40.1 s | 171.8 s | 131.7 s | Approx. · measured in video |
| OpenAI | 228 s | 278.25 s | 50.25 s | Approx. · measured in video |
| Apple Intelligence | 335.25 s | 356.5 s | 21.25 s | Approx. · measured in video |
File selection, preparation and extraction before “Analyzing”, as well as opening the saved result afterwards, are excluded. Displayed minutes and seconds are rounded. Qwen's run had already finished when the recording began, so its start and end cannot be checked in the video.
This is one run per option, not a speed benchmark. The recording does not establish exact model versions or controlled device and network conditions. A shorter wait does not establish a more accurate explanation.
Choosing what to read
Which presentation helps with your question?
The differences are easiest to see in what each result makes prominent. Use the original excerpts to compare those choices yourself.
Qwen
For reading the lipid panel value by value, then moving on to risk context and terminology.
Mistral
For keeping report details at hand and looking up the terminology used in the blood-count summary.
OpenAI
For finding the cholesterol discussion quickly and preparing concrete questions about its context.
Apple Intelligence
For a compact overview of extracted findings, with the limitations of the technical wording visible here.
More text is not automatically more useful. In this example, the useful distinction is between value-by-value explanation, report detail, discussion prompts and a compact facts view.
From a report to an explanation
Read the explanation alongside your document.
ExplainThisDoc brings a document and its explanation together. This example shows four ways the same report can be presented in the app.
Discover ExplainThisDocThe examples above show the recorded results from 11 October 2026.